I think you missed the point!
I guess it could be a translation of which is the chicken and which is the egg? Dilbert has been so on point!

I think you missed the point!
I guess it could be a translation of which is the chicken and which is the egg? Dilbert has been so on point!

Calm down… calm down!

There have been many reactions to data…
and articles often (i.e. BigData in HR: Why it’s Here and What it Means, Big Data in HR: The Opportunity, How BigData Tools Helps HR Understand You - Forbes, on and on) mention how data can help a business with understanding the customers they serve and the engagement of their employees. They’re have also been articles mentioning the need for HR professionals to pay attention, learn and use how data can be used to benefit them.
Don’t get it twisted
but don’t confuse the availability of that data versus the use of that data. It the data, no matter how big, is not used in context with what the business or its employees are facing then it can be confused as a virus when it really is just a symptom of the opportunity/problem you are trying to address. Too many people use data they collect in the wrong way. They use it to reinforce their assumptions rather than take a look at the picture data presents to make decisions for the short term and the long-term.
Use data, don’t abuse it
The key in analyzing data is making the content match the context. Just having people answer questions and then coming up with spreadsheets and graphs to prove your own point should not be a goal, not to mention it can illegal and unethical (dependent on who is reporting and how the data is presented - or just how much of a spotlight you have on you!)
Here are a few charts that will put our cost, spending and compensation for healthcare into perspective.
Enjoy!
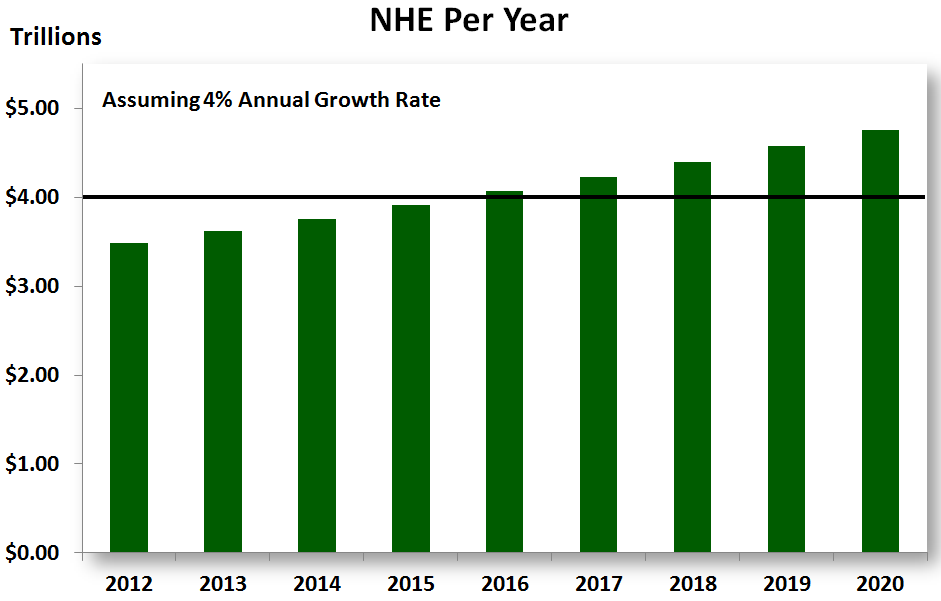
National Healthcare Expenditure (NHE)
Using a conservative annual growth rate of 4% (from Deloitte’s baseline year of 2010), Deloitte suggests the following as our real NHE.

Out of Pocket Healthcare Cost
The Kaiser Family Foundation (KFF) released this chart to highlight the growth of our largest single component of cost - Average Annual Premiums. This shows our corresponding increase in out-of-pocket healthcare expenses.
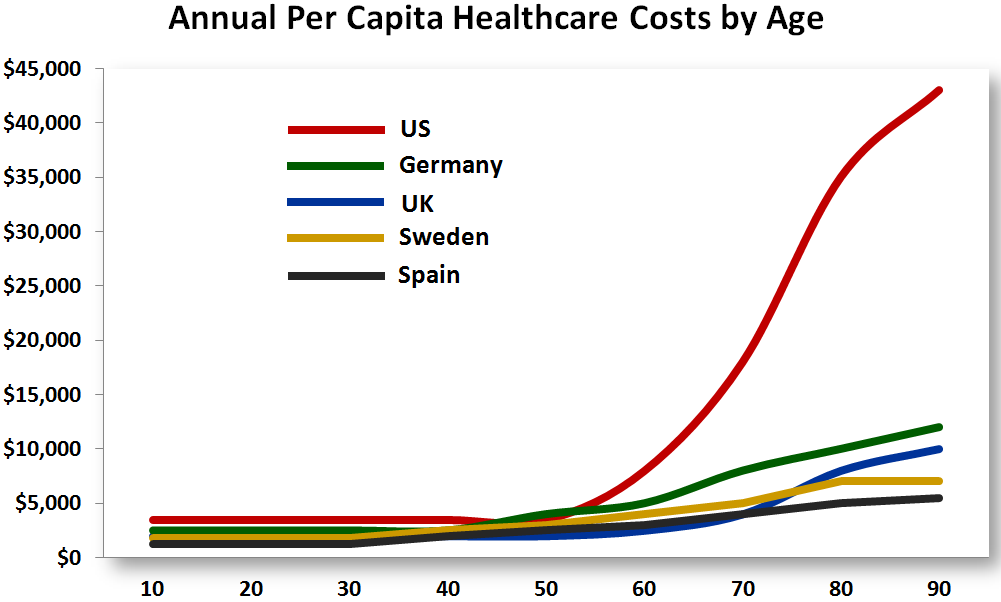
Assembled by Carnegie Mellon University professor Paul Fischbeck – and reported by Mark Roth of the Pittsburgh Post-Gazette (December, 2009) – and highlights our Per Capita Healthcare Costs by Age as compared to four other countries (Germany, the U.K., Sweden and Spain).

Physician Compensation
Here is Medscape’s Physician Compensation Report: 2012 Results.
I’m a business cycle person. I think that in order to be a great partner of people within a business you also have to be a good partner of and with the business. So for all the blogs, articles, and talk of those in my field always stating that we need to understand the “business” - here you go, a lesson from William Ackman on Everything You Need to Know About Finance and Investing. Enjoy your lemonade ;o)